Fig. 4
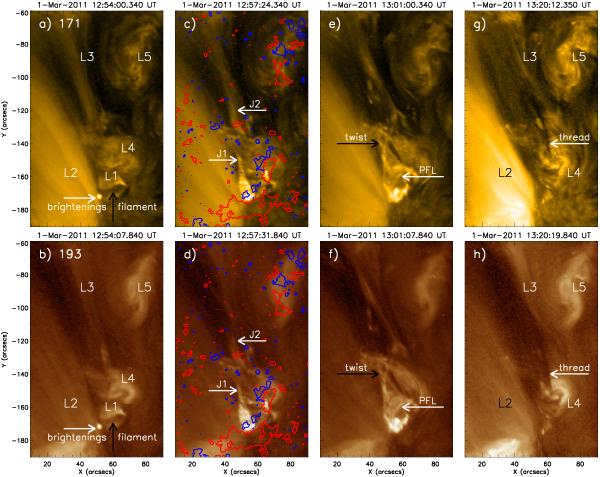
Coronal structures associated with the eruption in the original images of AIA 171 (top panels) and 193 Å (bottom panels). Contours of HMI longitudinal magnetic fields are also overlaid on the second column of images with positive fields in red and negative in blue. The levels are 20, 25, and 30 Gauss, respectively. L1−L5 denote the associated loops in the event. The temporal evolution in the AIA 171 Å as seen in the top panels is shown in the movie available in the online edition.
Current usage metrics show cumulative count of Article Views (full-text article views including HTML views, PDF and ePub downloads, according to the available data) and Abstracts Views on Vision4Press platform.
Data correspond to usage on the plateform after 2015. The current usage metrics is available 48-96 hours after online publication and is updated daily on week days.
Initial download of the metrics may take a while.