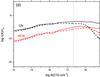
Fig. 5
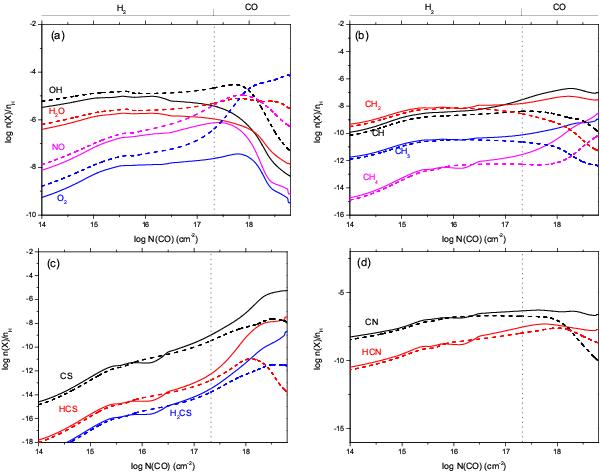
Relative abundances for a carbon-rich gas (C/O = 1.5, solid lines) and for an oxygen-rich gas (C/O = 0.66, dashed lines) for: a) O-bearing molecules; b) C-bearing molecules; c) S-bearing molecules; d) CN and HCN. The vertical line indicates the boundary between the H2 and CO regions. The line at the top indicates the H2 and CO regions in the nebula.
Current usage metrics show cumulative count of Article Views (full-text article views including HTML views, PDF and ePub downloads, according to the available data) and Abstracts Views on Vision4Press platform.
Data correspond to usage on the plateform after 2015. The current usage metrics is available 48-96 hours after online publication and is updated daily on week days.
Initial download of the metrics may take a while.