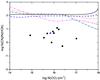
Fig. 6
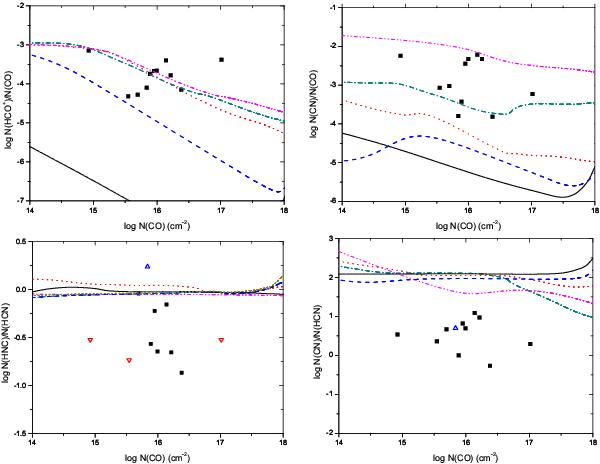
Column density ratios versus N(CO). Lines correspond to models T∗ = 5 × 10⁴ K and LX = 0 erg s-1 (solid lines); T∗ = 105 K and LX = 0 erg s-1 (dashed lines); T∗ = 3 × 10⁵ K and LX = 0 erg s-1 (dotted lines); T∗ = 105 K and LX = 1031 erg s-1 (dot-dashed lines); T∗ = 105 K and LX = 1032 erg s − 1 (dot-dot-dashed lines). Other parameters are those from the standard model. Squares and triangles represent observational data, with triangles indicating upper or lower limits, according to their orientation. (A color version of this figure is available in the online journal.)
Current usage metrics show cumulative count of Article Views (full-text article views including HTML views, PDF and ePub downloads, according to the available data) and Abstracts Views on Vision4Press platform.
Data correspond to usage on the plateform after 2015. The current usage metrics is available 48-96 hours after online publication and is updated daily on week days.
Initial download of the metrics may take a while.