Fig. 8
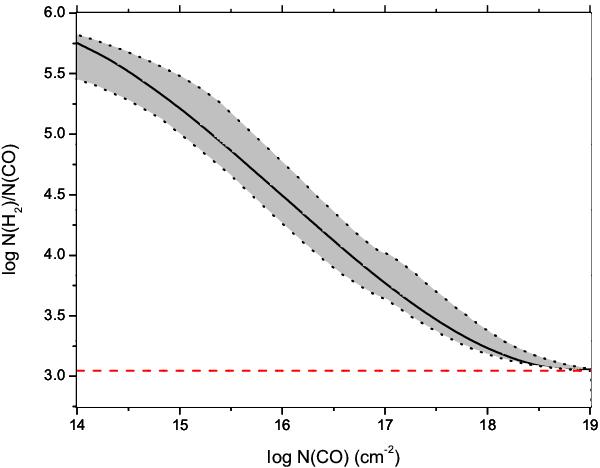
Column density ratio N(H2)/N(CO). The gray area indicates the range of values obtained with our grid of models. The solid line represents the values obtained for the standard model (Eq. (4)). The horizontal dashed line corresponds to the hypothesis of Huggins et al. (1996) that CO is fully associated, applied to the chemical composition of the standard model.
Current usage metrics show cumulative count of Article Views (full-text article views including HTML views, PDF and ePub downloads, according to the available data) and Abstracts Views on Vision4Press platform.
Data correspond to usage on the plateform after 2015. The current usage metrics is available 48-96 hours after online publication and is updated daily on week days.
Initial download of the metrics may take a while.