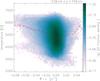
Fig. 12
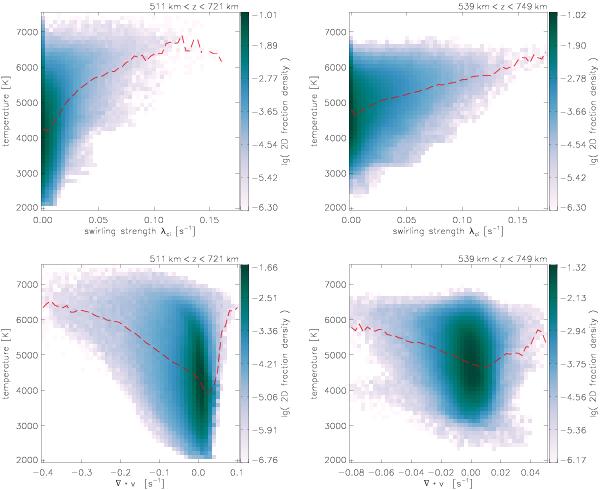
2D histograms relating the temperature (vertical axes) to swirling strength (upper panels) and velocity divergence (lower panels) in the upper photosphere. Results for the non-magnetic case are shown on the left panels and those for the magnetic case on the right panels. The dashed red lines indicate the mean temperature at a given value of the quantity on the horizontal axis. Each histogram is normalized by its 2D integral.
Current usage metrics show cumulative count of Article Views (full-text article views including HTML views, PDF and ePub downloads, according to the available data) and Abstracts Views on Vision4Press platform.
Data correspond to usage on the plateform after 2015. The current usage metrics is available 48-96 hours after online publication and is updated daily on week days.
Initial download of the metrics may take a while.