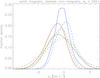
Fig. 5
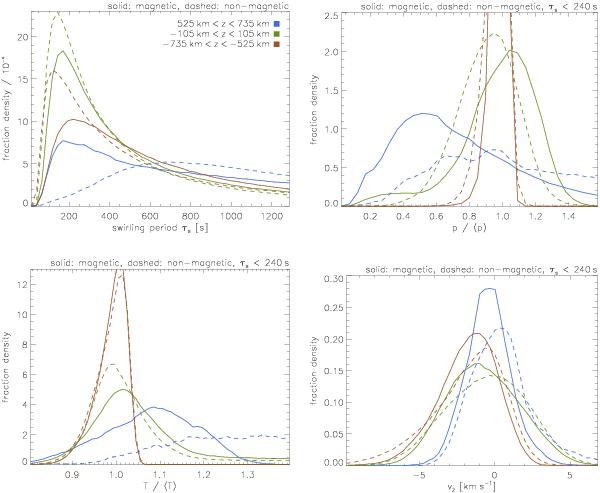
Histograms of various quantities in swirling regions for three layers of 210 km width each, centered at heights z = −630 km, z = 0 km, and z = 630 km. Solid lines represent the magnetic case, dashed lines the non-magnetic case. The quantities considered are swirling period (upper left panel), gas pressure normalized to its horizontal average (upper right), temperature normalized to its horizontal average (lower left), and vertical velocity component (lower right). Each histogram is normalized by its integral.
Current usage metrics show cumulative count of Article Views (full-text article views including HTML views, PDF and ePub downloads, according to the available data) and Abstracts Views on Vision4Press platform.
Data correspond to usage on the plateform after 2015. The current usage metrics is available 48-96 hours after online publication and is updated daily on week days.
Initial download of the metrics may take a while.