Fig. 15
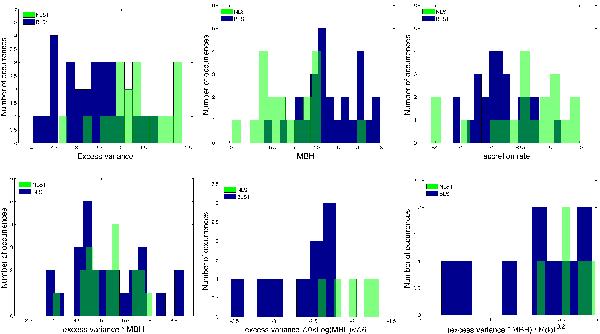
Upper left panel: the light green histogram shows the excess variance distribution of the NLS1 which are variable in 20 ks segments and present in CAIXAvar. The blue histogram shows the excess variance distribution for the other (broad line Seyfert 1) sources in CAIXAvar. The NLS1 are significantly (KS test) more variable than BLS1. Upper middle panel: MBH distribution (colour code as before). The NLS1 have smaller BH masses than BLS1. Upper right panel: accretion rate distribution. The NLS1 are accreting at significantly higher accretion rates than BLS1. Lower left panel:  distribution. Once that the MBH dependence is taken into account the NLS1 are not anymore distinguishable from BLS1. Lower middle panel: excess variance distribution of the AGN with 7.0 < Log(MBH) < 7.6. At the same MBH, NLS1 are more variable than BLS1 objects. Lower right panel: /ṁ0.2 distribution for the AGN with 7.0 < Log(MBH) < 7.6. The higher variability of the NLS1 objects can be due to their higher accretion rate.
Current usage metrics show cumulative count of Article Views (full-text article views including HTML views, PDF and ePub downloads, according to the available data) and Abstracts Views on Vision4Press platform.
Data correspond to usage on the plateform after 2015. The current usage metrics is available 48-96 hours after online publication and is updated daily on week days.
Initial download of the metrics may take a while.