Fig. 16
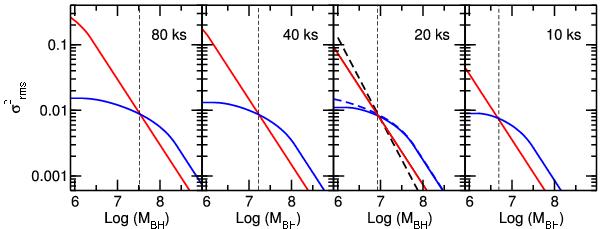
Left panel: expected  vs. MBH relations for AGN with an accretion rate of 0.01 (red lines) and 1 (blue lines) in Model B scenario and computed with 250 s bins and 80 ks intervals. Middle left: same as before but for 40 ks intervals. Middle right: same as before but for 20 ks intervals. Dashed lines show the expected
  computed with time bins of 50 s. Right panel: 10 ks intervals.
Current usage metrics show cumulative count of Article Views (full-text article views including HTML views, PDF and ePub downloads, according to the available data) and Abstracts Views on Vision4Press platform.
Data correspond to usage on the plateform after 2015. The current usage metrics is available 48-96 hours after online publication and is updated daily on week days.
Initial download of the metrics may take a while.