Free Access
Fig. 5
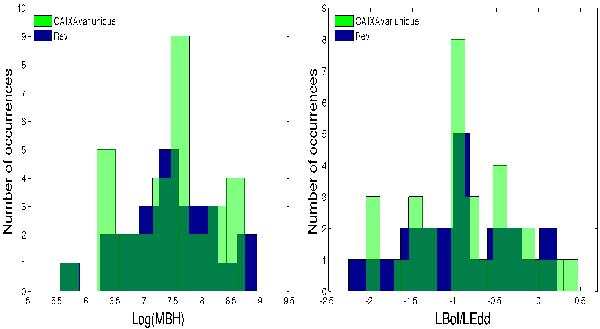
Left panel: the MBH distribution of the sources which are variable in 20 ks intervals and belong to the Rev sample (blue histogram), and to the CAIXAvar sample only (light green histogram). Right panel: the accretion rate distribution of the same sources.
Current usage metrics show cumulative count of Article Views (full-text article views including HTML views, PDF and ePub downloads, according to the available data) and Abstracts Views on Vision4Press platform.
Data correspond to usage on the plateform after 2015. The current usage metrics is available 48-96 hours after online publication and is updated daily on week days.
Initial download of the metrics may take a while.