Fig. 6
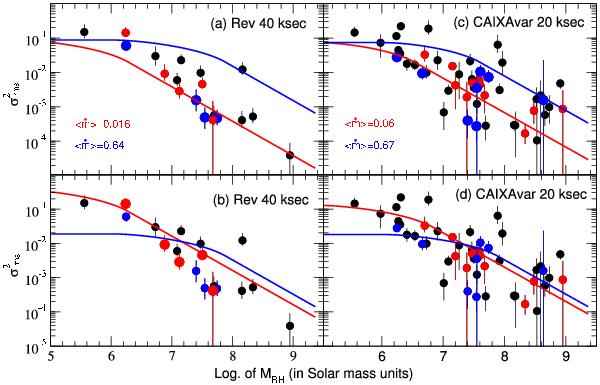
Upper left:  vs. MBH for the Rev sample. Red and blue filled circles indicate sources with ṁ in the ranges (0.0098–0.035) and (0.42–0.86), respectively, thus with average accretion rates of ⟨ ṁ ⟩ = 0.016 and 0.64, respectively. While the black filled circles show the for the sources with different accretion rates. The red and blue lines indicate the expected Model A relations for the two accretion rates. Upper right: CAIXAvar (20 ks) and Model A predictions (color code as before). Lower left and right: Model B predictions.
Current usage metrics show cumulative count of Article Views (full-text article views including HTML views, PDF and ePub downloads, according to the available data) and Abstracts Views on Vision4Press platform.
Data correspond to usage on the plateform after 2015. The current usage metrics is available 48-96 hours after online publication and is updated daily on week days.
Initial download of the metrics may take a while.