Fig. 7
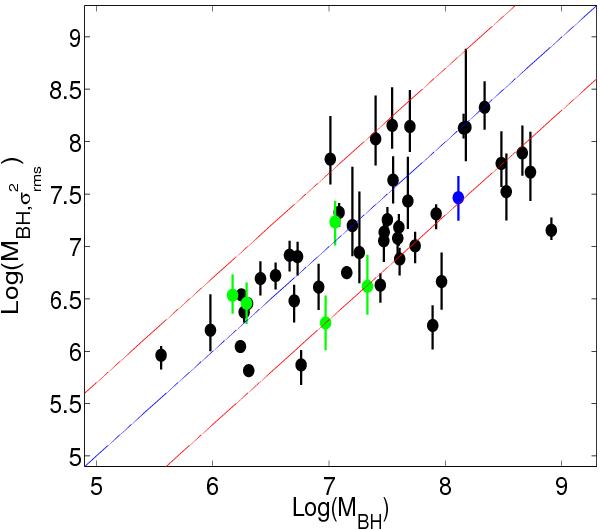
MBH measured from the  vs. MBH best fit relation of the Rev sample, as a function of the MBH estimated in other ways. Black, blue and green points show the results from
  , respectively. The blue line, in Fig. 7 corresponds to the one-to-one relation between the two MBH estimates, and the red lines indicate a dispersion of a factor of 5, along the x-axis.
Current usage metrics show cumulative count of Article Views (full-text article views including HTML views, PDF and ePub downloads, according to the available data) and Abstracts Views on Vision4Press platform.
Data correspond to usage on the plateform after 2015. The current usage metrics is available 48-96 hours after online publication and is updated daily on week days.
Initial download of the metrics may take a while.