Free Access
Fig. 9
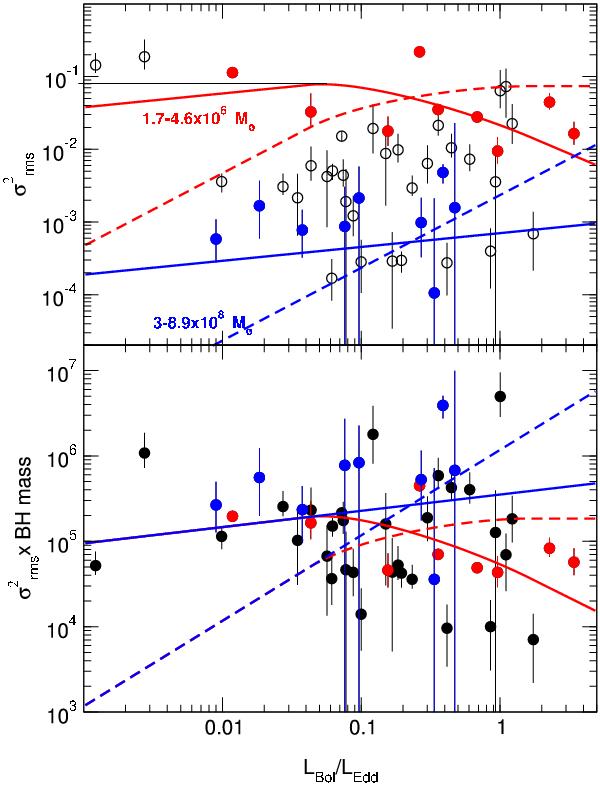
The  vs. ṁ relation for the CAIXAvar (20 ks) sample. Red and blue circles indicate sources with MBH in the range 1.7–4.6 × 10⁶ M⊙ and 3–8.9 × 10⁸ M⊙. Red and blue lines indicate the expected relations for mean MBH of 2.5 × 10⁶ and 5 × 10⁸ M⊙, respectively. Dashed and solid lines show the Model A and Model B predictions.
Current usage metrics show cumulative count of Article Views (full-text article views including HTML views, PDF and ePub downloads, according to the available data) and Abstracts Views on Vision4Press platform.
Data correspond to usage on the plateform after 2015. The current usage metrics is available 48-96 hours after online publication and is updated daily on week days.
Initial download of the metrics may take a while.