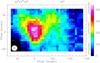
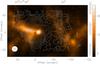
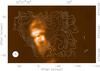
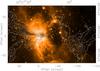
Fig. 1
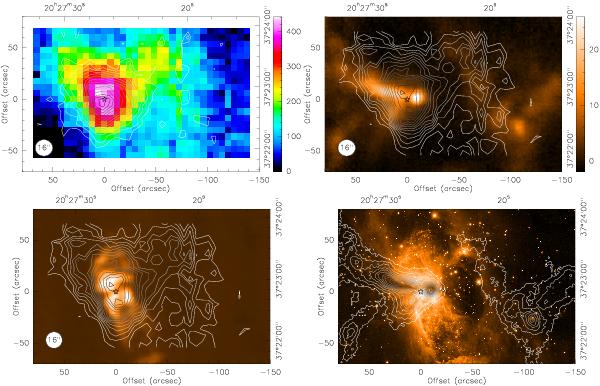
Top: integrated intensity (vLSR –20 to 20 km s-1) of [C II] (color) and CO 11 → 10 (contours from 15 to 215 in steps of 15 K km s-1). The position of S106 IR is indicated by a star and the SOFIA beam size for [C II] is drawn in the bottom left corner. On the right, contours of [C II] integrated intensity are shown on the SHARC-II 350 μm image (intensities in Jy/beam). Bottom: overlays of [C II] on 1.47 GHz radio continuum (left, VLA archival data) and SHARC-II 350 μm contours (right) on the Subaru near-IR image.
Current usage metrics show cumulative count of Article Views (full-text article views including HTML views, PDF and ePub downloads, according to the available data) and Abstracts Views on Vision4Press platform.
Data correspond to usage on the plateform after 2015. The current usage metrics is available 48-96 hours after online publication and is updated daily on week days.
Initial download of the metrics may take a while.