Free Access
Fig. 2
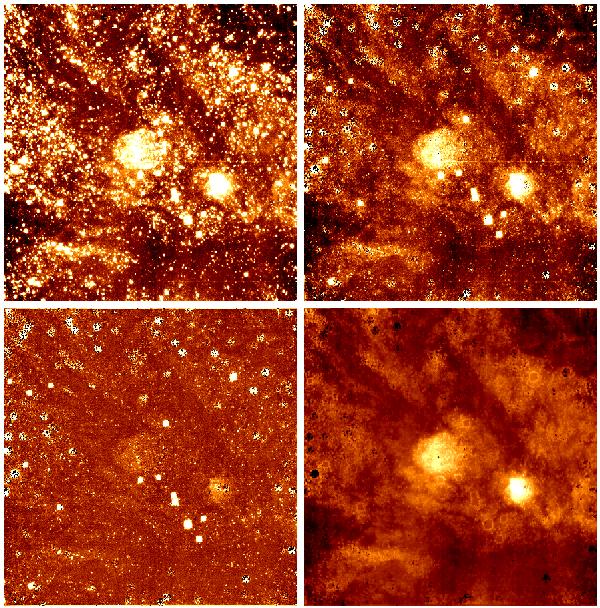
Result of the image filtering. Upper left: KS band image. Upper right: the same image after one allstar pass, with the detected sources subtracted. Lower left: the same image after spatial filtering. Lower right: the nebulosity that has been filtered out in the process.
Current usage metrics show cumulative count of Article Views (full-text article views including HTML views, PDF and ePub downloads, according to the available data) and Abstracts Views on Vision4Press platform.
Data correspond to usage on the plateform after 2015. The current usage metrics is available 48-96 hours after online publication and is updated daily on week days.
Initial download of the metrics may take a while.