Fig. 3
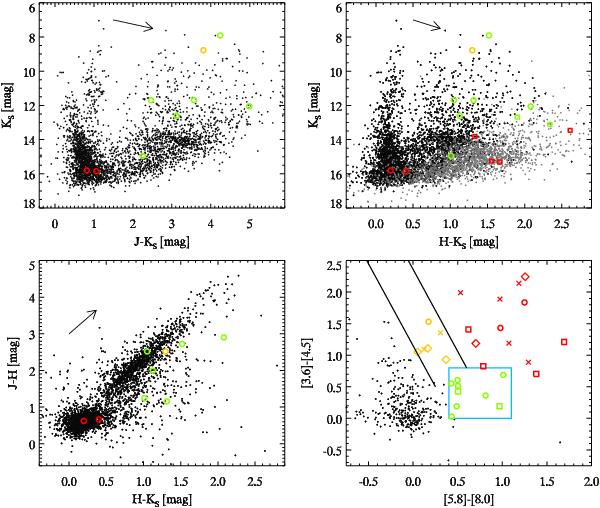
Photometry of CN15/16/17. Black dots are stars identified in J, H and KS bands, gray dots (upper-right: only) are stars identified only in H and KS. YSOs are shown in red (class I), green (class II) and yellow (reddened class II). Among the YSOs, the circles are sources with JHKS photometry, the squares are objects with only HKS detections, the diamonds are objects with only KS and the crosses are objects detected neither in J, H or KS. The black arrows in the near-infrared diagrams are the reddening vectors for AKS = 0.5 mag, according to the Rieke & Lebofsky (1985) reddening law (suitable for these wavelengths). Upper left: KS vs. J − KS diagram. Upper right: KS vs. H − KS diagram. Lower left: J − H vs. H − KS diagram. Lower right: IRAC [3.6]–[4.5] vs. [5.8]–[8.0] color–color diagram. The cyan box indicates the locus of class II objects according to Allen et al. (2004). The two black lines are parallel to the reddening vector derived by the Mathis (1990) extinction law (suited for mid infrared wavelengths) and enclose the region of reddened class II objects according to Megeath et al. (2004).
Current usage metrics show cumulative count of Article Views (full-text article views including HTML views, PDF and ePub downloads, according to the available data) and Abstracts Views on Vision4Press platform.
Data correspond to usage on the plateform after 2015. The current usage metrics is available 48-96 hours after online publication and is updated daily on week days.
Initial download of the metrics may take a while.