Fig. 8
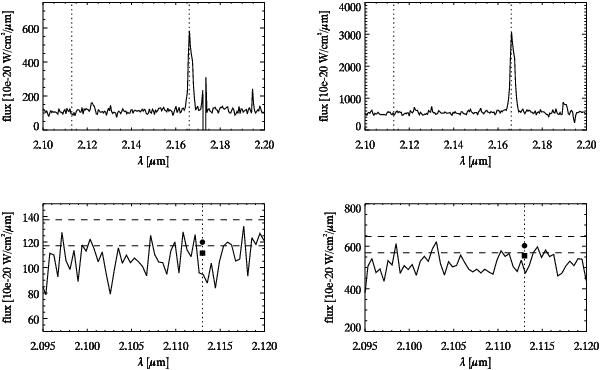
Spectra of the diffuse nebulae in the DB10 (left) and DB11 (right) regions. The positions of the Brγ and the He i 2.113 lines are marked by vertical dotted lines. The lower panels are a zoomed-in version in the wavelength region of the He i 2.113 line. The horizontal dashed lines represent 1 and 3σ levels above the continuum. The squares and the circles represent the expected peak values of the He i 2.113 line in the case of a 1% and 3% He i/Brγ flux ratio, respectively.
Current usage metrics show cumulative count of Article Views (full-text article views including HTML views, PDF and ePub downloads, according to the available data) and Abstracts Views on Vision4Press platform.
Data correspond to usage on the plateform after 2015. The current usage metrics is available 48-96 hours after online publication and is updated daily on week days.
Initial download of the metrics may take a while.