Fig. 5
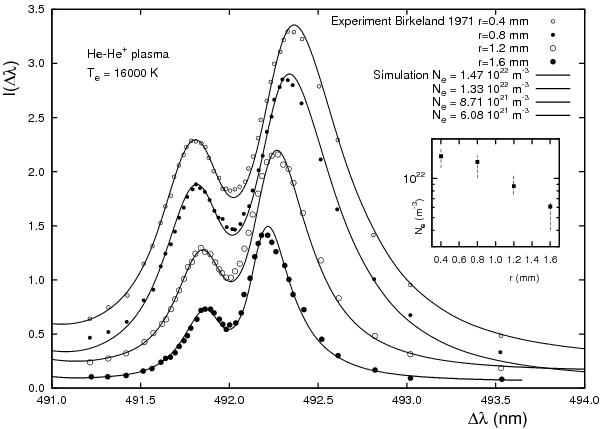
Comparison between experimental and simulated full line profiles for different conditions of the plasma electron density corresponding to four radial positions in the experiment. The square within the figure shows with dashed lines the range of electron densities obtained from different methods in the experiment, while the squared point corresponds to the electron density of the calculated profile for each position.
Current usage metrics show cumulative count of Article Views (full-text article views including HTML views, PDF and ePub downloads, according to the available data) and Abstracts Views on Vision4Press platform.
Data correspond to usage on the plateform after 2015. The current usage metrics is available 48-96 hours after online publication and is updated daily on week days.
Initial download of the metrics may take a while.