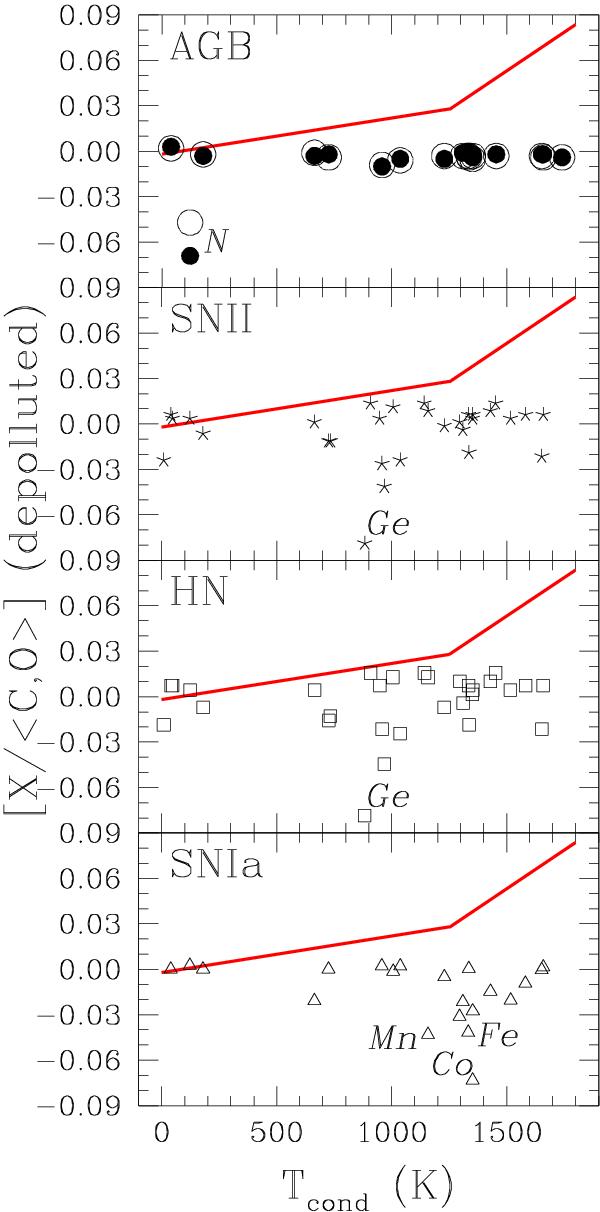
Fig. 7

Abundance ratios obtained after de-polluting the solar nebula from contamination by an AGB star (circles), SNII (stars), hypernova (squares) and SNIa (triangles). In the top panel the effect of adopting different solar abundances (open circles: Anders & Grevesse 1989; filled circles: Asplund et al. 2009) is shown. The solid line represents the mean abundance pattern of 11 solar twins relative to the Sun (Meléndez et al. 2009). None of the pollution scenarios can explain the trend with condensation temperature. For clarity, the abundance ratios of SNII, HN and SNIa have been divided by 4, 3.5 and 14, respectively. The chemical elements that change the most are labeled.
Current usage metrics show cumulative count of Article Views (full-text article views including HTML views, PDF and ePub downloads, according to the available data) and Abstracts Views on Vision4Press platform.
Data correspond to usage on the plateform after 2015. The current usage metrics is available 48-96 hours after online publication and is updated daily on week days.
Initial download of the metrics may take a while.


