Fig. 1
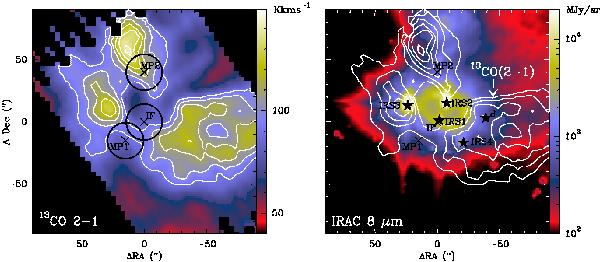
Left: map of the integrated intensity between −5 and 15 km s-1 of the 13CO 2 → 1 line observed at the IRAM 30 m telescope (lower contour at 90 K km s-1 and steps of 10 K km s-1, from Pilleri et al. 2012). The three observed positions, IF, MP1, MP2, are indicated. The beam of the 30 m at 3 mm towards the three observed positions is also drawn. Right: IRAC 8 μm map towards Mon2. The extended emission is produced by the PAH bands at 7.7 μm. This figure shows the existence of an extended PDR in the cloud.
Current usage metrics show cumulative count of Article Views (full-text article views including HTML views, PDF and ePub downloads, according to the available data) and Abstracts Views on Vision4Press platform.
Data correspond to usage on the plateform after 2015. The current usage metrics is available 48-96 hours after online publication and is updated daily on week days.
Initial download of the metrics may take a while.