Fig. 1
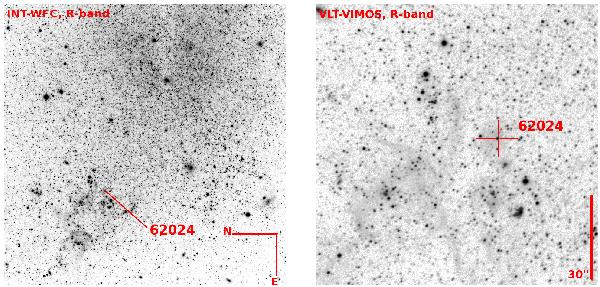
Finding chart for GHV-62024. The left part is an image obtained with the WFC at the INT in the R band. The region imaged (5 × 5 arcmin) contains the IC 1613 intense star-forming region, with many ionized bubbles. The right-hand side is a VLT-VIMOS image in the same band, at a larger scale (indicated by the scale bar at the right edge). The orientation is the same in both images.
Current usage metrics show cumulative count of Article Views (full-text article views including HTML views, PDF and ePub downloads, according to the available data) and Abstracts Views on Vision4Press platform.
Data correspond to usage on the plateform after 2015. The current usage metrics is available 48-96 hours after online publication and is updated daily on week days.
Initial download of the metrics may take a while.