Fig. 1
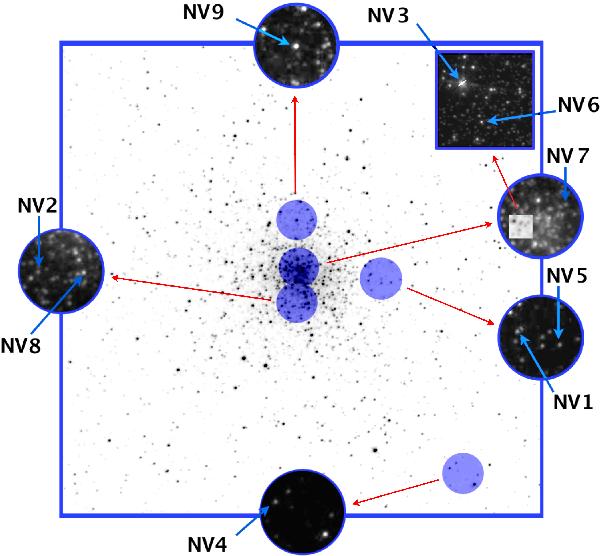
Finding chart for the newly discovered variable stars in M 28. The large image corresponds to a V-band image of the cluster, with the scale of the drawn blue square being 6.5 × 6.5 arcmin2. North is up and East is to the left. The five inner regions of the cluster where new variables have been detected are shown as blue circles superimposed on the main image. Blow-ups are shown for each of these regions, based on an F555W (V-band) Hubble Space Telescope image obtained with the WFPC2 camera (ID 6625, PI R. Buonanno). Each such circle covers a region of 30 arcsec diameter. In the top right, a 7.5 × 7.5 arcsec2 subregion of the circle containing NV3, NV6, and NV7 is shown on an expanded scale, for clarity.
Current usage metrics show cumulative count of Article Views (full-text article views including HTML views, PDF and ePub downloads, according to the available data) and Abstracts Views on Vision4Press platform.
Data correspond to usage on the plateform after 2015. The current usage metrics is available 48-96 hours after online publication and is updated daily on week days.
Initial download of the metrics may take a while.