Fig. 7
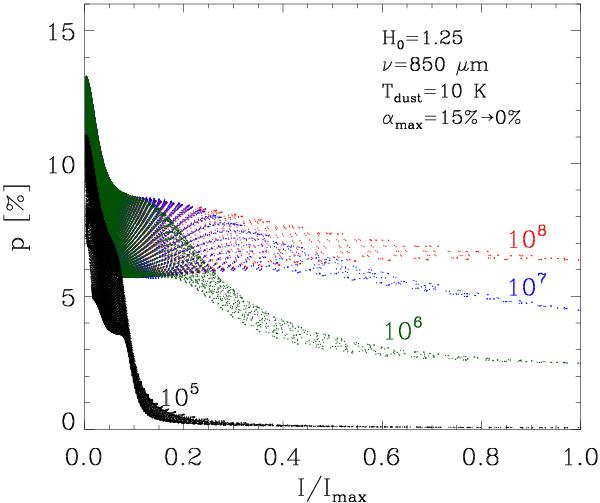
Degree of polarisation (p) as a function of the intensity normalised to its peak value (I/Imax) for the LS96 toroid as in Fig. 6. This plot shows the decrease in p for high values of I/Imax due to the assumption of a step function for the maximum degree of polarisation. Labels (105 to 108 cm-3) represent the limit on n(H2) above which αmax = 0.
Current usage metrics show cumulative count of Article Views (full-text article views including HTML views, PDF and ePub downloads, according to the available data) and Abstracts Views on Vision4Press platform.
Data correspond to usage on the plateform after 2015. The current usage metrics is available 48-96 hours after online publication and is updated daily on week days.
Initial download of the metrics may take a while.