Fig. 2
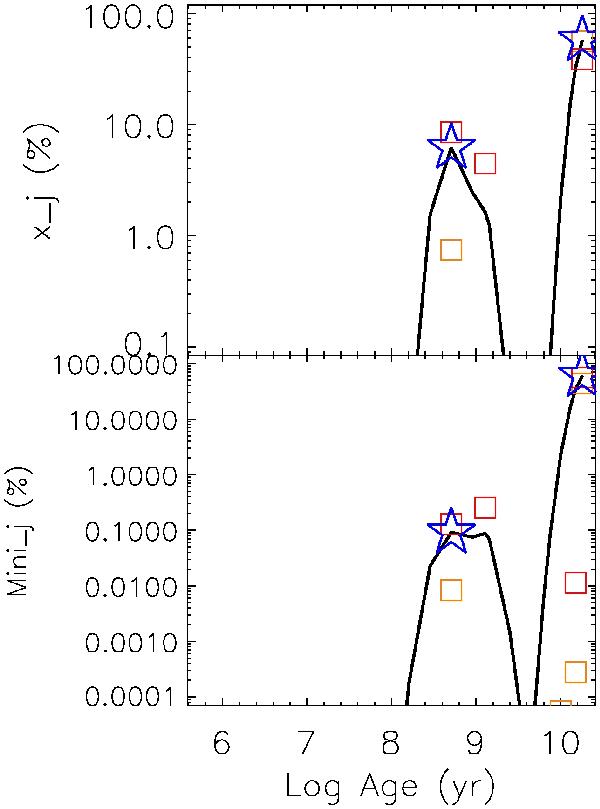
Age vs. mass fraction (bottom) and light fraction (top) of the stellar populations synthesized in the fitting of the spectrum of the X-shaped source J1201-0703. The squares correspond to stellar populations with different metallicities (in the color version: orange 1.0 Z⊙ and red 2.5 Z⊙). The solid curve represents Gaussian smoothing of the mass fraction and light fraction distributions. The resulting peaks or bursts of star formation are marked with a star.
Current usage metrics show cumulative count of Article Views (full-text article views including HTML views, PDF and ePub downloads, according to the available data) and Abstracts Views on Vision4Press platform.
Data correspond to usage on the plateform after 2015. The current usage metrics is available 48-96 hours after online publication and is updated daily on week days.
Initial download of the metrics may take a while.