Fig. 10
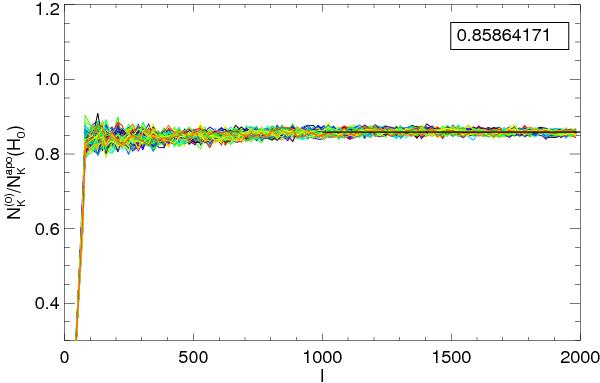
Color plots showing the ratio of the non-apodized N(0) term Eq. (5) to the reconstructed lensing variance in the patches apodized by W0.5 for each of the 100 maps of our unlensed (H0) set. A constant term, whose value is depicted in the upper box, is fitted to the ℓ ≥ 1000 part.
Current usage metrics show cumulative count of Article Views (full-text article views including HTML views, PDF and ePub downloads, according to the available data) and Abstracts Views on Vision4Press platform.
Data correspond to usage on the plateform after 2015. The current usage metrics is available 48-96 hours after online publication and is updated daily on week days.
Initial download of the metrics may take a while.