Fig. A.6
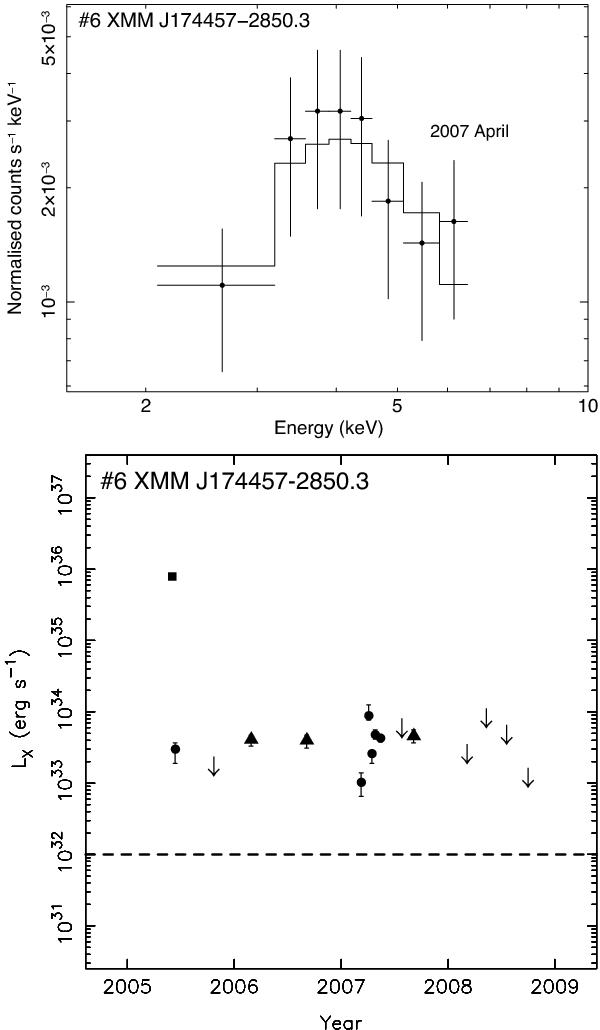
Background-corrected Chandra/ACIS spectrum (top) and 2–10 keV luminosity evolution (bottom) of the unclassified X-ray transient XMM J174457–2850.3. In the lightcurve the square (HRC) and bullets (ACIS) indicate Chandra data, whereas triangles are used for XMM-Newton observations. The upper limit symbols represent a 2σ confidence level and the horizontal dashed line indicates the quiescent luminosity of the source.
Current usage metrics show cumulative count of Article Views (full-text article views including HTML views, PDF and ePub downloads, according to the available data) and Abstracts Views on Vision4Press platform.
Data correspond to usage on the plateform after 2015. The current usage metrics is available 48-96 hours after online publication and is updated daily on week days.
Initial download of the metrics may take a while.