Fig. 1
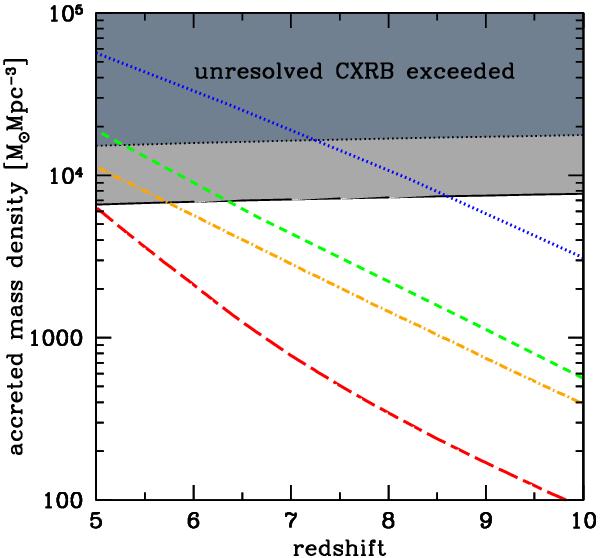
Limits on the density of accreted mass onto MBHs at z ≳ 5 derived from the unresolved fraction of the CXRB observed at 1.5 keV. Dark shaded area refers to the maximum allowed CXRB intensity and light shaded area is the limit once the contribution of lower-z AGNs is taken into account. For illustration, four curves show the accreted mass density of models of formation and evolution of MBHs presented in Volonteri & Begelman (2010). These mass densities should be considered qualitative, rather than quantitative, estimates, but they provide the typical range found when assuming a fixed accretion rate for all MBHs and self-regulated growth (see also Treister et al. 2011, for additional examples). The dotted curve refers to a model that induces an early reionization, and the short-dashed curve to a model that barely reproduces the mass function of z ~ 6 quasars. These two curves assume massive MBH seeds and fEdd = 0.3. The dot-dashed curve is analogous to the short-dashed model, but assumes the distribution of fEdd given by Merloni & Heinz (2008). The long-dashed curve is based on Population III remnants, and, while being consistent with the CXRB constraint, is unsuccessful in assembling 109 M⊙ MBHs by z ≃ 6.
Current usage metrics show cumulative count of Article Views (full-text article views including HTML views, PDF and ePub downloads, according to the available data) and Abstracts Views on Vision4Press platform.
Data correspond to usage on the plateform after 2015. The current usage metrics is available 48-96 hours after online publication and is updated daily on week days.
Initial download of the metrics may take a while.