Fig. 2
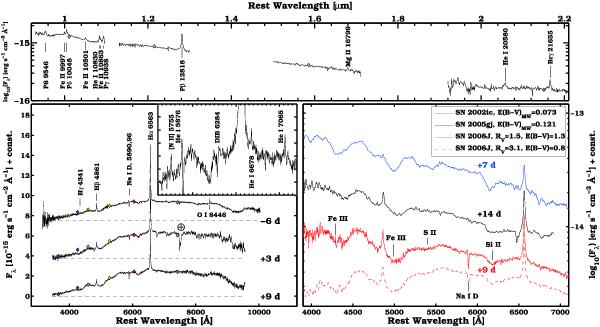
(Top panel) NIR spectrum of SN 2008J at 5 days before Bmax. The spectrum has been scaled to match NIR photometry (colored diamonds). Paschen emission lines as well as He i and Fe ii are visible. (Left panel) Optical spectroscopy of SN 2008J. Each spectrum has been scaled to match optical photometry. Days since Bmax are reported, and horizontal dashed lines correspond to zero flux level. Prominent Balmer lines, Na i D, narrow O i λ8446 and telluric features are labelled. In the inset we indicate He i narrow emission lines in the first spectrum. Features attributed to [N ii] λ5755 and diffuse interstellar bands (λ6284) are also discernible. (Right panel) Spectral comparison of SN 2008J to SNe 2002ic (Hamuy et al. 2003) and 2005gj (Prieto et al. 2007) at comparable epochs. Each spectrum has been de-reddened (see legend).
Current usage metrics show cumulative count of Article Views (full-text article views including HTML views, PDF and ePub downloads, according to the available data) and Abstracts Views on Vision4Press platform.
Data correspond to usage on the plateform after 2015. The current usage metrics is available 48-96 hours after online publication and is updated daily on week days.
Initial download of the metrics may take a while.