Fig. 1
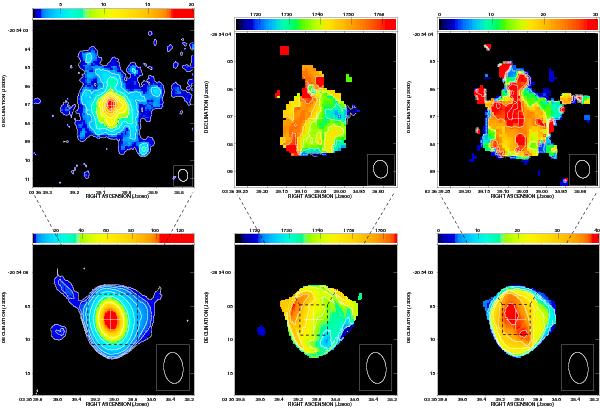
Top panels: high-resolution moment maps of 12CO 2−1. Left: integrated intensity with contour levels 2 × (1,2, 3, 4, 5, 6, 7, 8, 9) Jy beam-1 km s-1 and grayscale ranging from 2 to 20 Jy beam-1 km s-1. The cross marks the position α: 03:36:39.073 δ: –20:54:07.08, which is the position of peak TB(12CO 2−1). Center: velocity field with contour levels starting at 1713 km s-1 and then increasing by steps of 8.6 km s-1. The grayscale ranges from 1713 to 1764 km s-1. Right: dispersion map where contours start at 5 km s-1 and then increase by steps of 10 km s-1. Grayscale ranges from 0 to 30 km s-1 and peak dispersion is 90 km s-1. Lower panels: low-resolution moment maps of 12CO 2−1. Left: integrated intensity with contour levels 0.9 × (1,2,4,8,16,32,64) Jy beam-1 km s-1 and grayscale ranging from 0 to 129 Jy beam-1 km s-1. Center: velocity field with contour levels starting at 1713 km s-1 and then increasing by steps of 8.6 km s-1. The grayscale ranges from 1713 to 1764 km s-1. Right: dispersion map where contours start at 8.6 km s-1 and then increase by steps of 6.4 km s-1. Grayscale ranges from 0 to 40 km s-1 and peak dispersion is 65 km s-1. Note that the high-resolution moment 1 and 2 maps are on a somewhat different scale compared to the moment 0 map to better show the details of the velocity field and dispersion map. (In the online version of this figure the grayscale is replaced with a rainbow color scale ranging from dark blue to red.)
Current usage metrics show cumulative count of Article Views (full-text article views including HTML views, PDF and ePub downloads, according to the available data) and Abstracts Views on Vision4Press platform.
Data correspond to usage on the plateform after 2015. The current usage metrics is available 48-96 hours after online publication and is updated daily on week days.
Initial download of the metrics may take a while.