Fig. 4
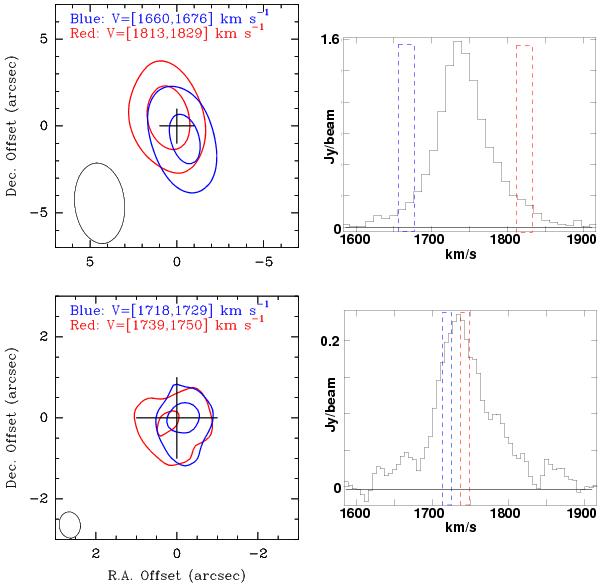
Left: top panel: blue (dark) (V = 1660−1676 km s-1) and red (light) (V = 1813−1829 km s-1) showing the location of the wings of the global 12CO spectrum. We used the low-resolution data for maximum sensitivity. Lower panel: blue (dark) (V = 1718−1729 km s-1) and red (light) (V = 1739−1750 km s-1) part of the central spectrum of the high-resolution data. The velocities are selected to not overlap with the line wings. Contours are given every 3σ. Two velocity components – perpendicular to each other – can be discerned. Right: top panel: low-resolution 12CO 2−1 spectrum where the spectral regions in the line wings used to make the figure to the left are indicated. Lower panel: high-resolution 12CO 2−1 spectrum where the spectral regions in the line center used to make the figure to the left are indicated. (In the online version of this figure dark contours are blue and light contours are red.)
Current usage metrics show cumulative count of Article Views (full-text article views including HTML views, PDF and ePub downloads, according to the available data) and Abstracts Views on Vision4Press platform.
Data correspond to usage on the plateform after 2015. The current usage metrics is available 48-96 hours after online publication and is updated daily on week days.
Initial download of the metrics may take a while.