Fig. 6
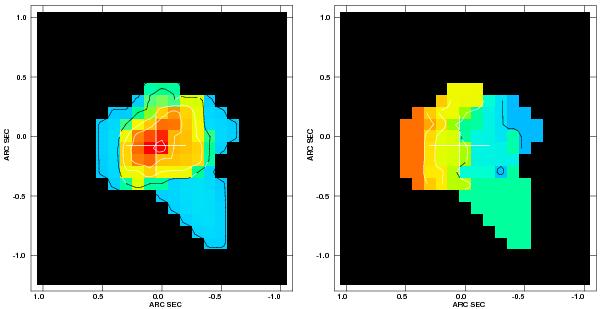
Integrated intensity and velocity maps of the high-resolution data where only emission in excess of 190 mJy was included to show the location and orientation of the nuclear disk. The position of the cross is the same as in Fig. 1. Left panel: integrated intensity where contour levels are 0.72 × (1, 3, 5, 7, 9) Jy beam-1 km s-1 and the grayscale ranges from 0 to 7.2 Jy beam-1 km s-1. Right panel: velocity field with contour levels starting at 1725 km s-1 and then increasing by steps of 5 km s-1. The grayscale ranges from 1720 to 1750 km s-1. The synthesized beam is 0 ''65 × 0 ''52. (In the online version of this figure the grayscale is replaced with a rainbow color scale ranging from dark blue to red.)
Current usage metrics show cumulative count of Article Views (full-text article views including HTML views, PDF and ePub downloads, according to the available data) and Abstracts Views on Vision4Press platform.
Data correspond to usage on the plateform after 2015. The current usage metrics is available 48-96 hours after online publication and is updated daily on week days.
Initial download of the metrics may take a while.