Fig. D.2
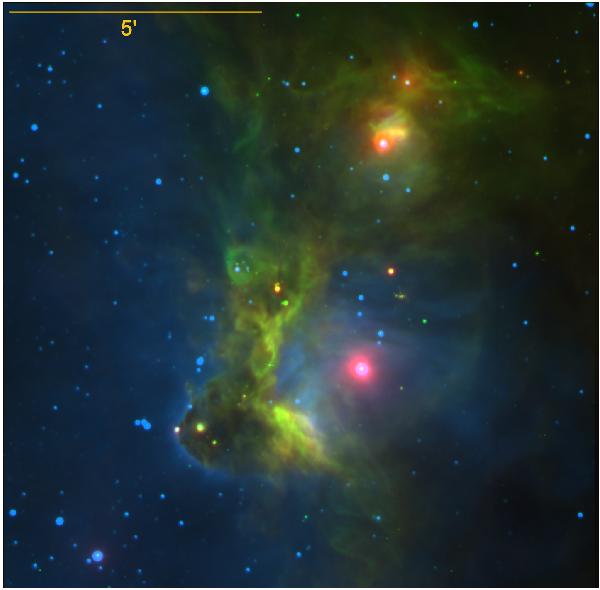
Colour composite image of the region located between W5-E and W5-W. Red is the Spitzer-MIPS emission from the hot dust at 24 μm, green is the Spitzer-IRAC emission at 5.8 μm from the YSOs and the PDRs (PAH emission), blue is the Hα emission of the ionized gas.
Current usage metrics show cumulative count of Article Views (full-text article views including HTML views, PDF and ePub downloads, according to the available data) and Abstracts Views on Vision4Press platform.
Data correspond to usage on the plateform after 2015. The current usage metrics is available 48-96 hours after online publication and is updated daily on week days.
Initial download of the metrics may take a while.