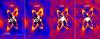
Fig. 3

Top: simulated disk (model HR 4796SD) inserted into the data: images (linear scale) reduced with cADI, mcADI, LOCI and mLOCI, for a rotation angle amplitude of 85 deg similar to that of our data. Bottom: idem for a disk model assuming αout = −4 (model HR 4796blowoutSD). North is up and East is to the left. The real disk is NE-SW oriented; the simulated one is NW-SE oriented.

Current usage metrics show cumulative count of Article Views (full-text article views including HTML views, PDF and ePub downloads, according to the available data) and Abstracts Views on Vision4Press platform.
Data correspond to usage on the plateform after 2015. The current usage metrics is available 48-96 hours after online publication and is updated daily on week days.
Initial download of the metrics may take a while.