Fig. 1
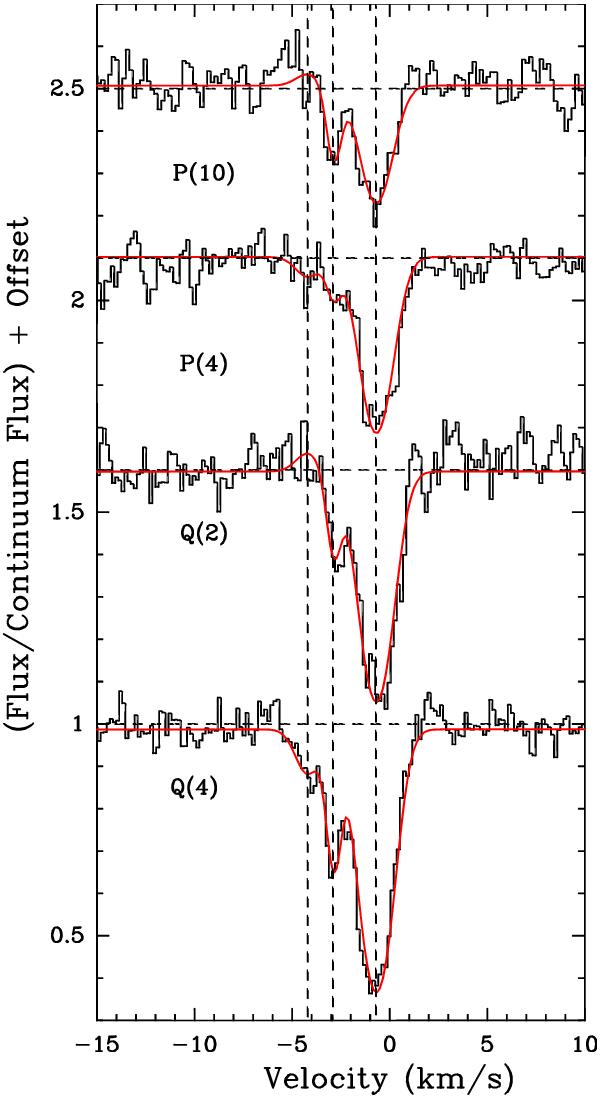
HIFI observations of the C3 lines in DR21(OH). The spectra are corrected for the DSB continuum and normalized to the SSB continuum level. The Q(2), P(4), and P(10) spectra are shifted consecutively by +0.5, so that the plots do not overlap. The red line shows the simultaneous fit with three Gaussian velocity components (at −0.7, −2.9, and −4.2 km s-1). Note that the third component is only detected above the noise in Q(4) and P(4). The “negative” absorption bumps at this velocity fitted in Q(2) and P(10) are within the noise.
Current usage metrics show cumulative count of Article Views (full-text article views including HTML views, PDF and ePub downloads, according to the available data) and Abstracts Views on Vision4Press platform.
Data correspond to usage on the plateform after 2015. The current usage metrics is available 48-96 hours after online publication and is updated daily on week days.
Initial download of the metrics may take a while.