Fig. 3
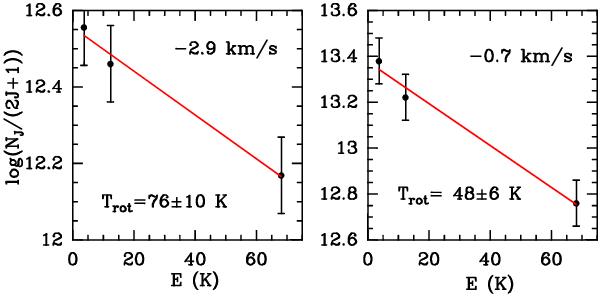
Rotation diagram of C3 for the velocity components at −0.7 km s-1 and −2.9 km s-1. The errorbars correspond to an estimated error of 10% in the state specific column densities and are conservative estimates, which include uncertainties due to continuum measurements as well as the noise in the spectra.
Current usage metrics show cumulative count of Article Views (full-text article views including HTML views, PDF and ePub downloads, according to the available data) and Abstracts Views on Vision4Press platform.
Data correspond to usage on the plateform after 2015. The current usage metrics is available 48-96 hours after online publication and is updated daily on week days.
Initial download of the metrics may take a while.