Fig. 8
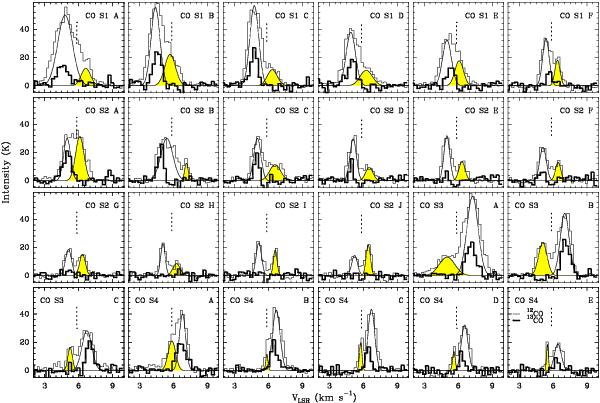
Spectra of 12CO 2−1 (thin line) and 13CO 2−1 (thick line) on
the locations of CO spirals. The alphabet order labels the distance to the stellar
location: A is the closest, while J is the most distant one. The
separations between the spectra is 0 56. The shaded Gaussian indicates the
integration area used to estimate the spiral mass. The dotted vertical line marks
Vsys of 5.85 km s-1.
56. The shaded Gaussian indicates the
integration area used to estimate the spiral mass. The dotted vertical line marks
Vsys of 5.85 km s-1.
Current usage metrics show cumulative count of Article Views (full-text article views including HTML views, PDF and ePub downloads, according to the available data) and Abstracts Views on Vision4Press platform.
Data correspond to usage on the plateform after 2015. The current usage metrics is available 48-96 hours after online publication and is updated daily on week days.
Initial download of the metrics may take a while.