Fig. 10
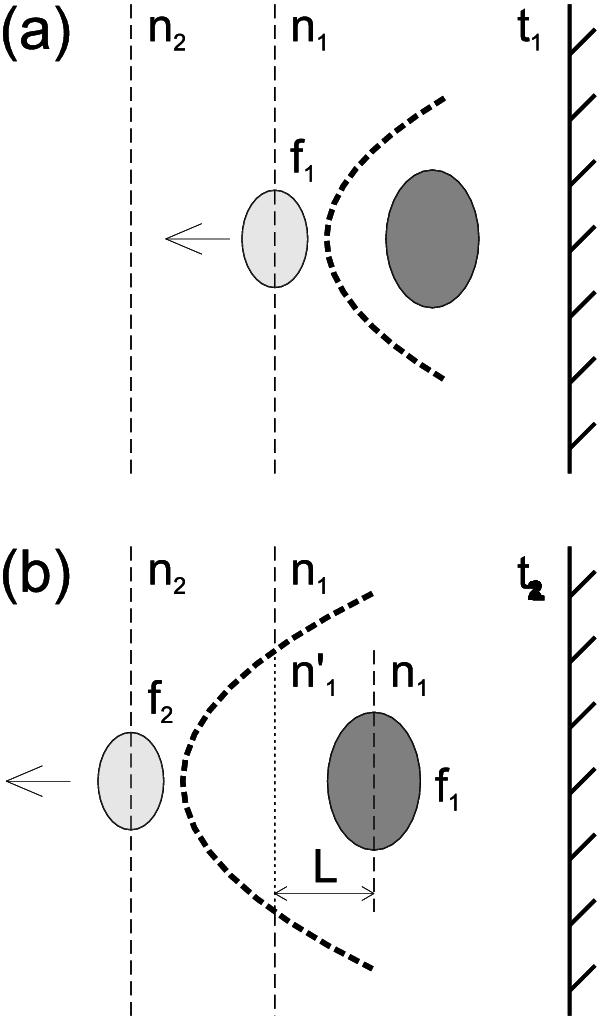
Schematic illustration of the lower location of the HFC sources of the type II burst with respect to the LFC sources observed at the same frequency. Panel a) corresponds to an instant t1, which is before the instant t2 (t2 > t1) of panel b). Solar surface is depicted by thick black line with inclined ticks on the right. Thick dashed arc-like line shows the shock wave front. Light and dark grey ellipses represent the LFC and HFC sources, respectively. Horizontal arrow shows the direction of their movement. Levels of constant plasma density are shown by vertical straight dashed and dotted lines. Corresponding plasma densities are marked by n1,  , n2, with
  and n1 > n2. Corresponding second harmonic of plasma frequencies, at which the LFC and HFC sources are emitted, are marked by f1 and f2, with f1 > f2.
Current usage metrics show cumulative count of Article Views (full-text article views including HTML views, PDF and ePub downloads, according to the available data) and Abstracts Views on Vision4Press platform.
Data correspond to usage on the plateform after 2015. The current usage metrics is available 48-96 hours after online publication and is updated daily on week days.
Initial download of the metrics may take a while.