Fig. 2
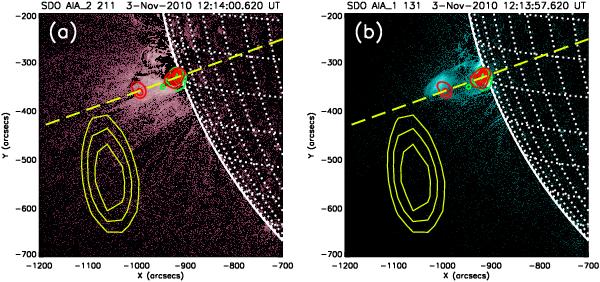
Active area near the eastern limb of the Sun in the impulsive phase of the 3 November 2010 eruptive flare. AIA 211 Å a) and 131 Å b) base-difference images are overlaid by the RHESSI 6−12 keV (12:13:54−12:14:14 UT; light green) and 25−50 keV (12:13:54–12:14:14 UT; red) contours (20%, 40%, 60%, 80% of the peak flux), indicating locations of the flare soft and hard X-ray sources, respectively. AIA 211 Å base image was made at ≈12:00:02 UT and 131 Å base image – at ≈12:00:11 UT. Yellow ellipses are the NRH 445 MHz contours (70%, 80%, and 90% of the peak flux), which indicate the location of the decimetric radio emission source at the same moment. The thick dashed yellow straight line indicates a projection of the radius-vector passing through the centroid of the flare soft X-ray source onto the image plane.
Current usage metrics show cumulative count of Article Views (full-text article views including HTML views, PDF and ePub downloads, according to the available data) and Abstracts Views on Vision4Press platform.
Data correspond to usage on the plateform after 2015. The current usage metrics is available 48-96 hours after online publication and is updated daily on week days.
Initial download of the metrics may take a while.