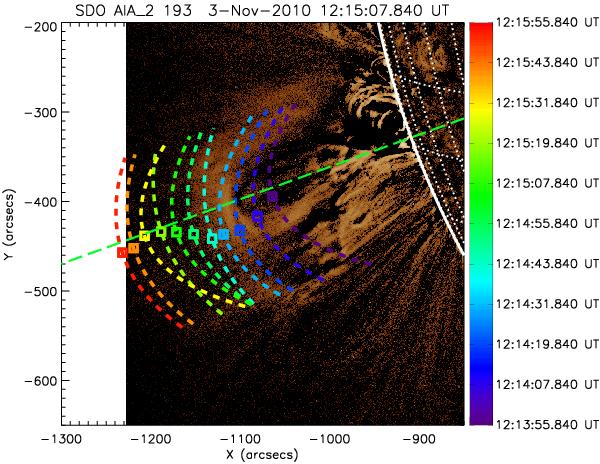
Fig. 3

Base-difference image of the active area near the eastern limb of the Sun made by AIA in 193 Å channel at ≈12:15:08 UT. The AIA base image was made at ≈12:00:08 UT. Dashed parabolic lines of different colors indicate the fitted LE of the eruptive plasma at an appropriate moment (see colorbar). The found parabolas’ apices are marked by squares. Green dashed straight line indicates a projection of the radius-vector passing through the flare onto the image plane (as in Fig. 2).
Current usage metrics show cumulative count of Article Views (full-text article views including HTML views, PDF and ePub downloads, according to the available data) and Abstracts Views on Vision4Press platform.
Data correspond to usage on the plateform after 2015. The current usage metrics is available 48-96 hours after online publication and is updated daily on week days.
Initial download of the metrics may take a while.


