Fig. 5
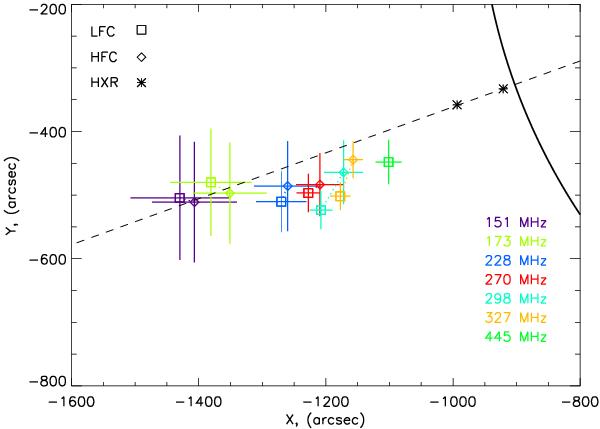
Average positions of the type II burst’s LFC and HFC sources observed by NRH at several frequencies during the 3 November 2010 eruptive event. Error bars of the LFC and HFC source centroid estimations are shown. Positions of the double coronal hard X-ray source observed by RHESSI in the flare impulsive phase are also plotted by two black asterisks for comparison. The straight black dashed line indicates a projection of the radius-vector passing through the double coronal HXR source onto the image plane. The solar optical limb is represented by black solid arc-like line.
Current usage metrics show cumulative count of Article Views (full-text article views including HTML views, PDF and ePub downloads, according to the available data) and Abstracts Views on Vision4Press platform.
Data correspond to usage on the plateform after 2015. The current usage metrics is available 48-96 hours after online publication and is updated daily on week days.
Initial download of the metrics may take a while.