Fig. 6
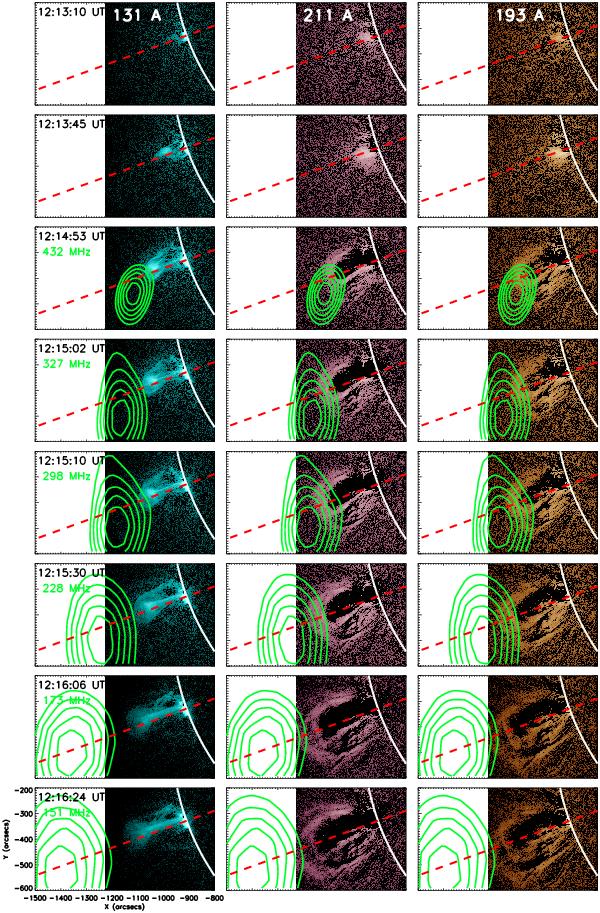
Partial time sequence of AIA/SDO 131, 211, and 193 Å base-difference images in between 12:13:10 UT and 12:16:30 UT of 3 November 2010. Overplotted are the iso-intensity contours (50%, 60%, 70%, 80%, and 90% of the maximum) of the LFC source observed by NRH at different frequencies at a vicinity of times of its first appearance (indicated in the upper left corner of the AIA 131 Å images). One-second integrated NRH data is used. The closest AIA images in time to the NRH ones are shown (the time difference is less than eight seconds in each case). Solar limb is depicted by the thick white line. The red dashed straight line in all panels indicates a projection of the radius vector passing through the X-ray flare onto the image plane. The AIA’s field of view is less than that of the NRH.
Current usage metrics show cumulative count of Article Views (full-text article views including HTML views, PDF and ePub downloads, according to the available data) and Abstracts Views on Vision4Press platform.
Data correspond to usage on the plateform after 2015. The current usage metrics is available 48-96 hours after online publication and is updated daily on week days.
Initial download of the metrics may take a while.