Fig. 7
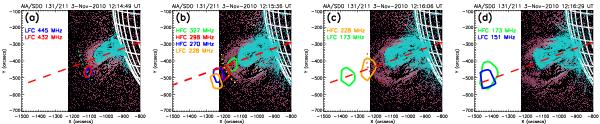
Composite base-difference images of the active area near the eastern limb of the Sun made by AIA in 131 Å (turquoise) and 211 Å (purple) passbands at four different times of the 3 November 2010 event. These times are marked by dash-dotted vertical lines in Figs. 4 and 8. Green, yellow, and red dashed parabolas on panels a), b) and c), respectively, indicate the approximated LE of eruptive plasma observed by AIA in 211 Å passband. The parabolas’ colors are consistent with the colorbar in Fig. 3. Solid lines of different colors are the NRH contours (95% of the peak flux), which indicate locations of centroids of the type II burst sources at different frequencies (indicated within each panel) at appropriate moments. All AIA and NRH images are matched within 5 s. Red dashed line in all panels indicates a projection of the radius-vector passing through the X-ray flare onto the image plane.
Current usage metrics show cumulative count of Article Views (full-text article views including HTML views, PDF and ePub downloads, according to the available data) and Abstracts Views on Vision4Press platform.
Data correspond to usage on the plateform after 2015. The current usage metrics is available 48-96 hours after online publication and is updated daily on week days.
Initial download of the metrics may take a while.