Fig. 9
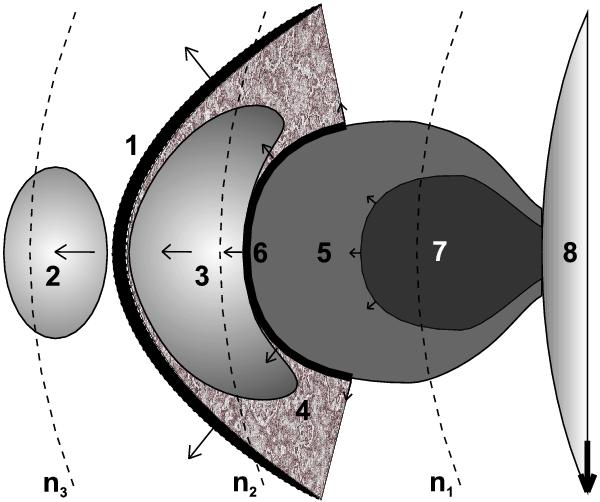
Schematic illustration of the 3 November 2010 eruptive event observations combined with their interpretation in the frame of the upstream-downstream scenario (see text). View is from the heliographic north pole. Direction to the Earth is marked by a thick black arrow. Notations: (1) hypothetical shock wave, (2) LFC source of the type II burst, (3) its HFC source, (4) turbulent magnetosheath, (5) warm (T ≈ 1−2 MK) plasma rim and (6) its LE, (7) hot (T ≃ 10 MK) erupting flux rope or plasma blob if observed from the Earth, (8) photosphere. Thin black arrows show directions of the eruptive plasmas, shock wave, LFC and HFC sources motion. Lengths of the arrows are proportional to the corresponding velocities of motion. Levels of constant undisturbed background electron plasma concentration, assuming the natural gravitational stratification, are marked by black dashed arc-lines, and n1 > n2 > n3.
Current usage metrics show cumulative count of Article Views (full-text article views including HTML views, PDF and ePub downloads, according to the available data) and Abstracts Views on Vision4Press platform.
Data correspond to usage on the plateform after 2015. The current usage metrics is available 48-96 hours after online publication and is updated daily on week days.
Initial download of the metrics may take a while.