Fig. 14
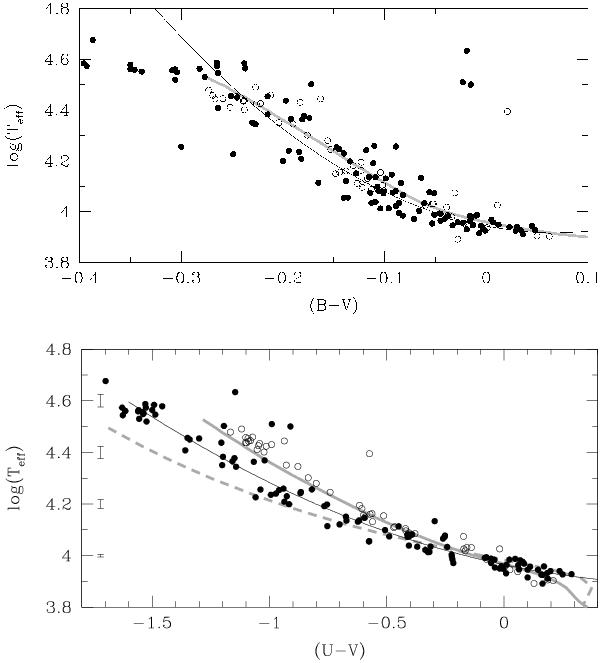
Photometric color of the program stars as function of their measured temperature (filled circles). The black curve indicates the fit of the data, Eqs. (3 and (4). The grey thick curve shows the theoretical zero-age HB of Cassisi et al. (2009). The same model, re-derived for the non-standard filters used in the adopted photometry, is shown with a dashed grey curve. Empty circles show the position of NGC 6752 stars (Moni Bidin et al. 2007).
Current usage metrics show cumulative count of Article Views (full-text article views including HTML views, PDF and ePub downloads, according to the available data) and Abstracts Views on Vision4Press platform.
Data correspond to usage on the plateform after 2015. The current usage metrics is available 48-96 hours after online publication and is updated daily on week days.
Initial download of the metrics may take a while.