Fig. 7
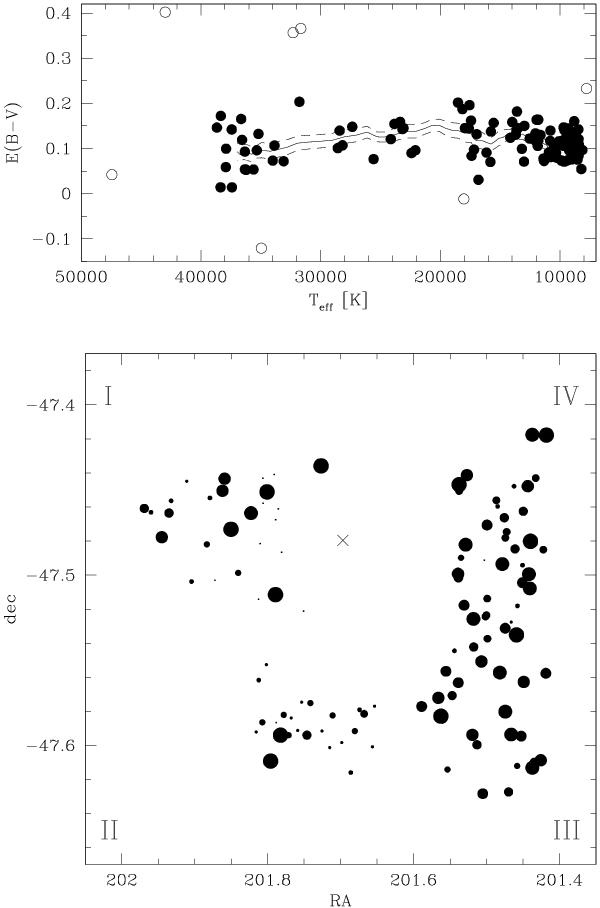
Upper panel: reddening estimates for program stars as a function of temperature. The deviant points are indicated with empty circles. The trend of the mean reddening (calculated as described in the text) with its 1-σ stripe is shown with full and dashed lines, respectively. Lower panel: spatial distribution of the observed stars, where the size of each plotted point is proportional to the star’s reddening. The cross indicates the cluster center.
Current usage metrics show cumulative count of Article Views (full-text article views including HTML views, PDF and ePub downloads, according to the available data) and Abstracts Views on Vision4Press platform.
Data correspond to usage on the plateform after 2015. The current usage metrics is available 48-96 hours after online publication and is updated daily on week days.
Initial download of the metrics may take a while.