Fig. 1
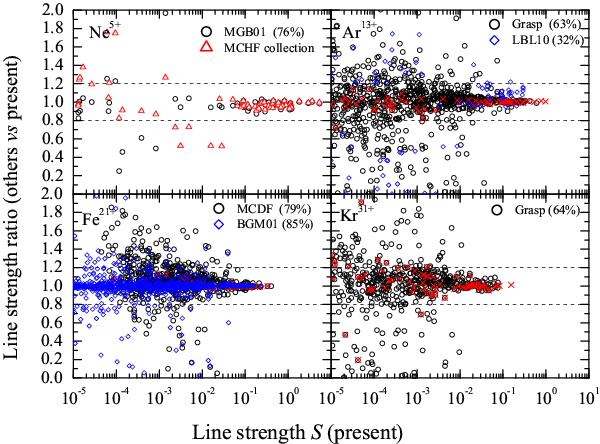
Comparison of line strengths (S) of electric-dipole transitions for ions spanning the sequence. For Ne5+, MGB01 corresponds to the MCHF calculation of Mitnik et al. (2001) for transitions among the lowest 20 levels, while “up-triangle” symbols correspond to the data from the MCHF/MCDF collection6. For Ar13+, comparisons are made with the grasp calculation by Aggarwal et al. (2005) and with the autostructure calculation by Ludlow et al. (2010, hereafter LBL10) for all transitions amongst levels of the n = 2 configurations. The “ × ” symbols denote transitions among the lowest 20 levels. For Fe21+, a comparison is made with the MCDF calculation (Jonauskas et al. 2006) and that of Badnell et al. (2001, hereafter BGM01) for all transitions amongst levels of the n = 2 configurations. The “ × ” symbols are the same as for Ar13+. For Kr31+, we compare with the grasp calculation by Aggarwal et al. (2008). The horizontal dashed lines correspond to an agreement within 20%.
Current usage metrics show cumulative count of Article Views (full-text article views including HTML views, PDF and ePub downloads, according to the available data) and Abstracts Views on Vision4Press platform.
Data correspond to usage on the plateform after 2015. The current usage metrics is available 48-96 hours after online publication and is updated daily on week days.
Initial download of the metrics may take a while.