Fig. 4
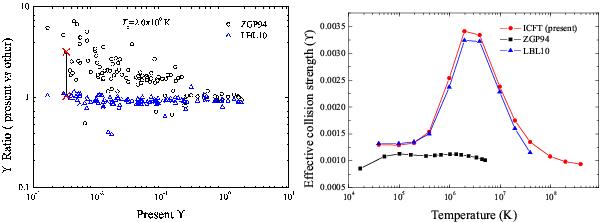
Comparison of effective collision strengths for Ar13+. Left: all excitations among the 15 levels of the n = 2 configurations at the temperature (Te = 4.0 × 10⁶ K) of peak fractional abundance in ionization equilibrium. The “ × ” symbol corresponds to the 2s22p 2P3/2 − 2p3 2P3/2 (1–15) excitation shown in the righthand panel, which is linked for the two different previous calculations. Double-horizontal lines correspond to agreement within 20%. Right: the effective collision strength of the 1–15 transition as a function of temperature (K). ZGP94 and LBL10 correspond to the Breit-Pauli R-matrix works of Zhang et al. (1994) and Ludlow et al. (2010), respectively.
Current usage metrics show cumulative count of Article Views (full-text article views including HTML views, PDF and ePub downloads, according to the available data) and Abstracts Views on Vision4Press platform.
Data correspond to usage on the plateform after 2015. The current usage metrics is available 48-96 hours after online publication and is updated daily on week days.
Initial download of the metrics may take a while.