Free Access
Fig. 3
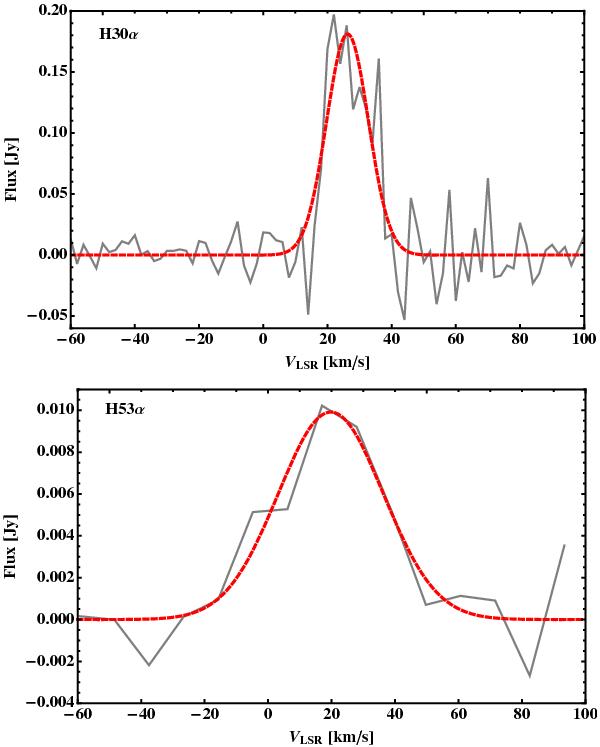
Hydrogen recombination line spectra (gray) and Gaussian fits (red) toward BN. The top panel shows the H30α line observed with ALMA. The flux is corrected by primary beam attenuation. The bottom panel shows the H53α line observed with the VLA. The channel widths are 2.0 km s-1 and 10.9 km s-1, respectively.
Current usage metrics show cumulative count of Article Views (full-text article views including HTML views, PDF and ePub downloads, according to the available data) and Abstracts Views on Vision4Press platform.
Data correspond to usage on the plateform after 2015. The current usage metrics is available 48-96 hours after online publication and is updated daily on week days.
Initial download of the metrics may take a while.