Fig. 1
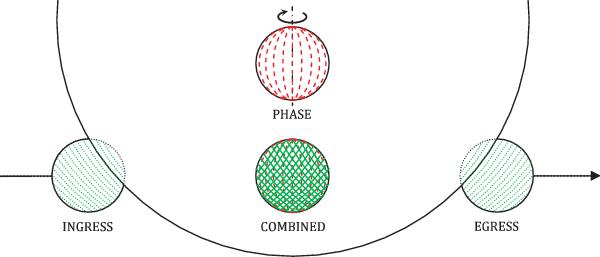
Schematic description of the different scanning processes observable for an occulted exoplanet. The green dotted lines indicate the scanning processes during the exoplanet occultation ingress/egress. The red dashed line indicates the scanning process that results from the exoplanet rotation and produces the exoplanet phase curve – this scanning appears longitudinal for an observer as long as the exoplanet spin is close to the projection plane, e.g., for a transiting and synchronized exoplanet. The component labeled “combined” shows the specific grid generated by these three scanning processes.
Current usage metrics show cumulative count of Article Views (full-text article views including HTML views, PDF and ePub downloads, according to the available data) and Abstracts Views on Vision4Press platform.
Data correspond to usage on the plateform after 2015. The current usage metrics is available 48-96 hours after online publication and is updated daily on week days.
Initial download of the metrics may take a while.