Fig. 10
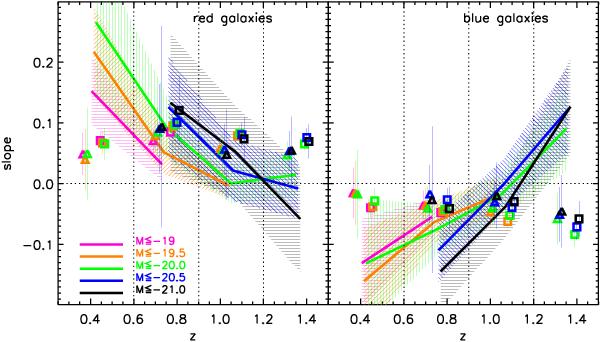
Slopes of the linear fits of the colour − density relation in each panel of Figs. 7 and 8, for fred on the left panel and fblue in the right panel. Lines and shaded areas: VVDS observed data with error. Triangles: Omocks. Squares: Cmocks. Different colours of lines and symbols are for the different luminosity thresholds, as indicated in the labels. In each redshift bin, delimited by vertical dashed lines, all points should be considered at the same (central) x-value, but they are shifted for clarity.
Current usage metrics show cumulative count of Article Views (full-text article views including HTML views, PDF and ePub downloads, according to the available data) and Abstracts Views on Vision4Press platform.
Data correspond to usage on the plateform after 2015. The current usage metrics is available 48-96 hours after online publication and is updated daily on week days.
Initial download of the metrics may take a while.