Fig. 10
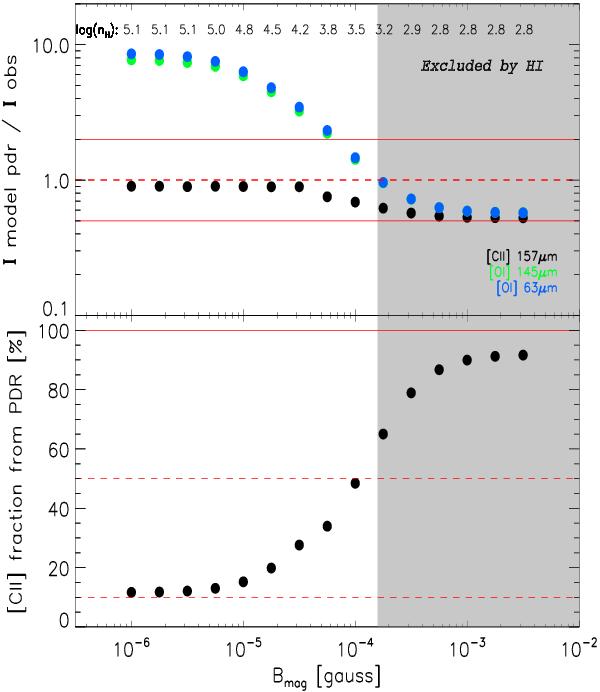
Influence of the magnetic field on the PDR lines. Top: model predictions of the [C ii] and [O i] intensities (Imodel) normalised by their observed value (Iobs) as a function of magnetic strength Bmag. The effective density in the PDR is indicated for each Bmag value. Bottom: fraction of [C ii] coming from the PDR, scaled to the [O i] 145 μm prediction, assuming that all of it originates in the PDR. Models in the shaded area are not valid with respect to the upper limit on the H i column density. (This figure is available in color in electronic form.)
Current usage metrics show cumulative count of Article Views (full-text article views including HTML views, PDF and ePub downloads, according to the available data) and Abstracts Views on Vision4Press platform.
Data correspond to usage on the plateform after 2015. The current usage metrics is available 48-96 hours after online publication and is updated daily on week days.
Initial download of the metrics may take a while.